Load Balancer in Go
I wanted to understand how load balancers actually work. While using AWS Application Load Balancer or nginx was easy as plug and play, I had no idea what happened inside these black boxes.
Building this taught me:
- How request routing really works at the code level
- Why fault tolerance patterns like circuit breakers are essential
- How to design resilient systems with proper health checks
- The importance of real-time monitoring and metrics collection
What I Actually Built
My load balancer includes these core components:
- Backend Pool Management - Tracks multiple server instances with health status
- Circuit Breaker Pattern - Prevents cascade failures with automatic recovery
- Active Health Checks - Monitors backend availability every 30 seconds
- Prometheus Metrics - Real-time observability with request counts, latencies, and error rates
How It Works
Backend Pool
Each backend server is represented with its URL, health status, weight, and timeout configuration. The pool manages these backends and selects the next healthy one using round-robin algorithm.
When a request comes in, the load balancer:
- Gets the next backend from the pool
- Checks if the circuit breaker allows the request
- Forwards the request with proper timeout handling
- Records metrics about the response
Circuit Breaker
Circuit breaker with three states - Closed, Open, and Half-Open. It tracks failure counts and uses mutex locks for thread safety. When failures exceed the threshold, it opens the circuit and starts rejecting requests immediately.
The circuit breaker automatically transitions to half-open state after a reset timeout to test if the backend has recovered.
Health Check System
Every 30 seconds, the health checker runs in a separate goroutine:
- For alive backends, it performs health checks
- For failed backends, it attempts recovery
- All checks run concurrently to avoid blocking
Failed backends are automatically removed from rotation and added back when they recover.
Prometheus Metrics Collection
The metrics system tracks:
- HTTP request counts by method, status code, and backend
- Request duration histograms with proper buckets
- Error counts by type and backend
- Current healthy backend count
- Circuit breaker states
A separate metrics server runs on port 9090 to serve Prometheus scrape requests.
Performance and Configuration
The load balancer is configured through environment variables:
Port=8080
MetricsPort=9090
LogLevel=info
Backends=http://localhost:3000,http://localhost:3001
Using Viper for configuration management allows easy deployment across environments.
The system uses Zap for structured logging and implements proper graceful shutdown with a 30-second timeout for in-flight requests.
Request Flow
When a request hits the load balancer:
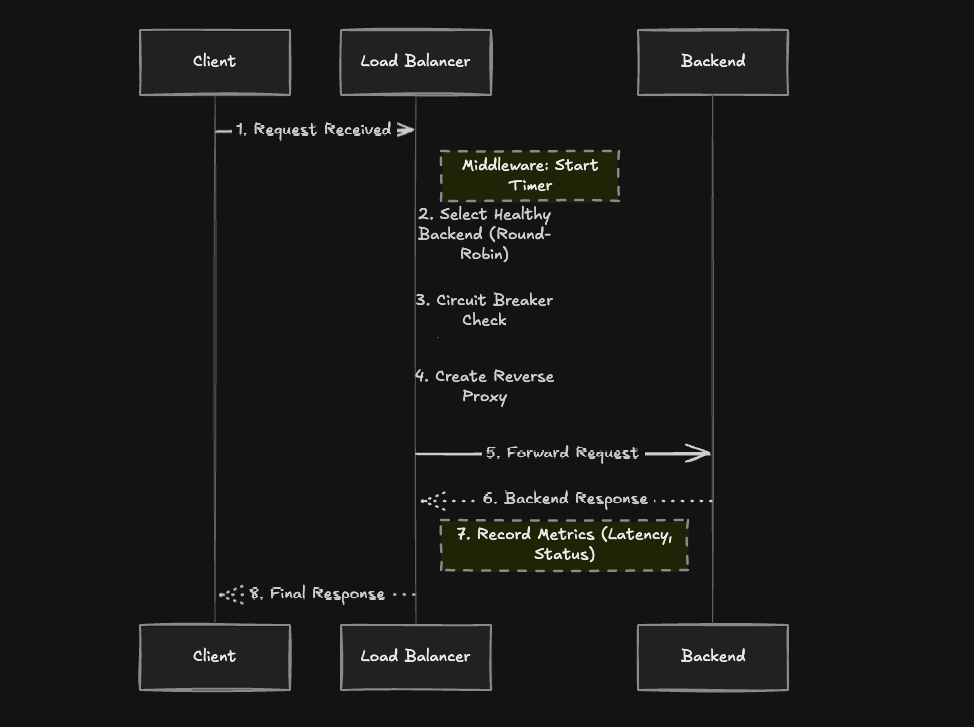
- Middleware captures the request start time
- Backend Selection - Pool returns next healthy backend using round-robin
- Circuit Breaker Check - Validates the backend can handle requests
- Proxy Creation - Creates a reverse proxy with the backend URL
- Request Forward - Proxy handles the actual HTTP forwarding
- Metrics Recording - Records latency, status code, and any errors
- Response - Returns the backend response to the client
The proxy automatically handles request/response headers and maintains the original request context.